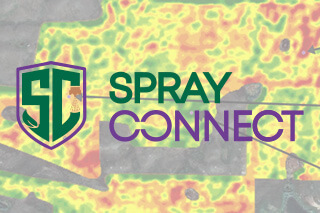
Seeding has concluded for the 2022 season and during this spring in the Northern Region of G-Mac's Country, we have had way better moisure conditions as compared to last year. Early seeded crops are beginning to emerge and we hope to get some rain for the crops to continue to grow rapidly. In this article, my goal is to dive deeper into disease management and discuss how SprayConnect can further optimize our application of fungicides, PCR's and so on. Nowadays, we see more variable rate compatible spray equipment than even seeding equipment. How can we utilize this technology that already exists within our operations?
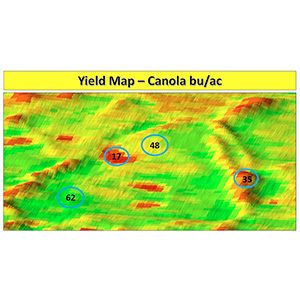
In the past few years working on the Ag Innovation team at G-Mac's AgTeam, I have gone through over 1000 calibrated yield maps and I have yet to see a single map that does not display some variability in yield across the field. Even in a flat field, we observe pockets of light textured soils (sandy) along with pockets of heavier textured soils (often saline or sodic). The different soil texture will reflect in the water holding capacity of those areas and will lead to the variation in crop growth (crop staging and structure).
.jpg?h=300&w=300&rev=922ea772124149aab157c54062eeab76&hash=A5F4D22D547DD5D5F8A403542863DB64)
What is the disease triangle?
The incidence and severity of plant diseases result from the impact of three factors:
- The host plant.
- The pathogen.
- Favourable environmental conditions.
If any one of these three factors is missing, no disease will occur.
We may not see all three of those elements across an entire field. If we take the host as an example, we can see less plants in the saline areas, wet depressions and eroded knolls with low organic matter.
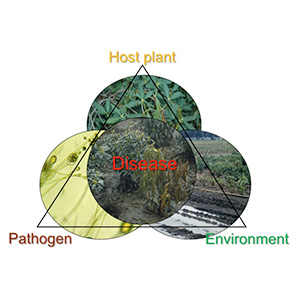
For many pathogens, we would expect to see higher disease pressure in an area with higher historical disease pressure.
For the environmental conditions, topography of the field plays a huge role in the distribution of water throughout the field.
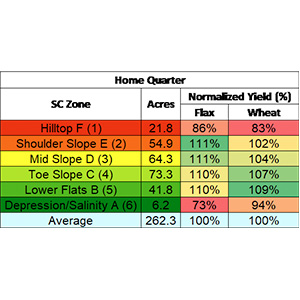
The three elements above are great for predictability but we still need to consider the risk and economics. Historical yield maps, SWAT maps, cost per bushel maps, and plant stand counts will help to better understand the performance and economics on every part of the field. Historical yield data paired with a SoilConnect management zone provides insight into how knolls, midslopes, depressions, and saline areas yield in field. All the information above will help to create a proper spatial recommendation when it comes to applying fungicides, PCR's, residual herbicides, and biologicals.
What is NDVI Technology?
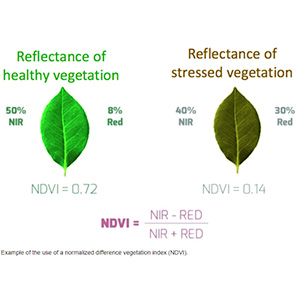
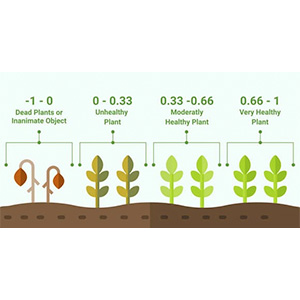
NDVI is the Normalized Difference Vegetation Index. A unit of measure designed to factor both red and infrared reflectance. NDVI is measured in a range from -1 to +1, with higher values indiciating greater plant health.
The first satellite was launched on July 23, 1972, with a multi spectral scanner (MSS) to determine it's capabilities for Earth remote sensing. The earliest reported use of NDVI study was in 1973 by the Remote Sensing Center of Texas A & M University.
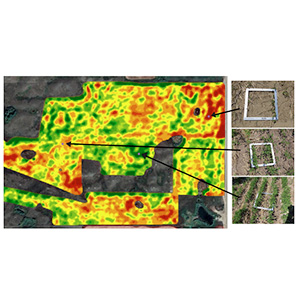
Today this technology is more widely used and available to us. To simplify, it is like taking a picture of your field and using mathematics to create spatial zones based on the amount of plant material or crop biomass present. Crop biomass data is a great layer for targeting site-specific fungicide applications as it is typically a strong indiciator of the presence of conductive environmental conditions and an economically viable host.
All of this means that we only need to treat the acres on the farm that demonstrate the greater risk of infection. In other words, rather than discussing the fields that do not require an investment in a fungicide application, we can focus on the acres that do. And that will lead to achieving a greater ROI. Plus, it will also help to reduce cost per bushel on high-risk areas.
The first rule in the G-Mac's AgTeam Four Rules of Agronomy is to "Always use sound Agronomy." SprayConnect is a service that operates on quality agronomy. We ground truth every field individually with NDVI maps on hand to make sure that variability is assessed correctly.
These images only demonstrate a difference in NDVI which could be the crop or weeds in some cases. That is why we have boots on the ground and take it seriously when it comes to ground truthing fields. After this process, site-specific recommendations are created for different management zones. Manual adjustments will be made if necessary, such as inset learning blocks or check strips before a prescription file is uploaded to the variable rate controller.
At G-Mac's AgTeam, we have knowledgeable experts on a variety of different manufacturer displays and rate controllers so that we can provide support for this exciting service designed for our growers. For more information on SprayConnect or to learn how you can take advantage of this service, contact your local G-Mac's AgTeam representative.