Now that the combines are edging closer to the finish line of the 2021 season, looking back at what we endured can be difficult to describe. Numbers can only tell so much, two inches of rain (or less) plus 40degree heat, the drought in 1988 was a year that I heard referenced a few times as well. Decent moisture from snow started us off okay, but once the rain turned off in June, all that the crop had left to support it was what was in the soil bank. Timely and sufficient rain can make an average field look amazing but this year, once the tap turned off, the areas of the field that had held extra snow through the winter really stood out. We sometimes saw a 40-50 bushel cereal crop flip into single digit bushel numbers in a matter of feet! What made the biggest difference between this year and last year? Water is the easy answer. But when that water is taken away from the field, why are we still seeing massive amounts of variable production? Looking at fields from a distance, different variables can be picked out causing production differences. But we can also look closer to see other impactful differences.
SoilConnect has and will always be about what our land can produce. We have a goal of producing the best return that the individual piece of land can create for the grower. Too look at this another way, rice and sugarcane are the largest production value and general tonnage producing crops, respectively, in the world. It seems obvious why there is not much of either crop grown in the G-Mac’s AgTeam trade area. Growing conditions are vastly different from where those crops are profitable, but changing our practices seems to stop as we start to zoom in closer to the field. Different decisions must be made to capitalize on productive land in different areas of the world. Our conditions are different; amount of rainfall, length of season, total heat units during the growing season. All of these factors account for why our crop mix is different than other countries, even from our corn and soybean growing neighbours to the South.
Getting even closer to home, a successful oat crop in Tisdale still looks much different than the expectations and uses for oats grown in the Southwest region of our trade area. Again, rainfall is a large determining factor here. But there is a lot more variability impacting the performance of the crops we decide to grow on our land as well. Organic matter, water holding capacity, weed pressure, land history. All of these factors impact the yield, even between neighbouring fields facing the same or similar environmental conditions. Many of these variables that impact our profitability field to field can be difficult or impossible to predict. Storm events, insects, and timing or severity of weed pressure are all variables that we need to react to every season. But something that rarely changes and still greatly impacts our yield on an acre-by-acre basis is topography and base soil characteristics like texture and organic matter.
Even though unpredictable variables impact our fields every year, patterns emerge over time. The same fields seem to under- or over-perform year over year. Canola may prefer some fields to others that are just miles away. Tweaking fertility decisions field by field using these historical trends is not uncommon but SoilConnect allows us to be even more precise by looking at productivity potential and fertility investment on every acre of the field. SoilConnect does this, not by using historical data to forecast future results (because there are many unique and unpredictable variables that can impact that data), but instead going right to the foundation of where field variability begins, the soil. Looking strictly at how the soil handles water and how water moves on the field is an objective way to project yield potential spatially. The amount of water that is potentially available to the crop is one of the most trustworthy ways to predict the crop’s yield in any given season.
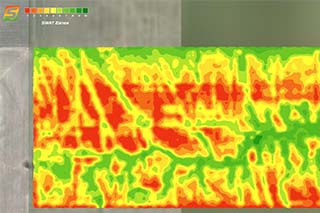
Predicting yield with other methods such as historic yield maps or imagery are pretty good methods to forecast production spatially. However, there will always be unpredictable variables impacting the result. Uncalibrated yield monitors, different seeding or harvest dates, weed pressure, or herbicide drift can all impact the yield monitor, or NDVI image, that you are using to emulate a map of the potential productivity of the land. Without additional soil sampling, there could be value in the form of background fertility left unaccounted for. By starting from the ground up, SoilConnect aims to eliminate as many unpredictable variables as possible from influencing our decisions. Instead, it focuses on the relationship of water, topography and the background fertility of our soil to provide investment recommendations on an acre by acre basis.
SoilConnect: Starting From The Ground Up
October 05, 2021